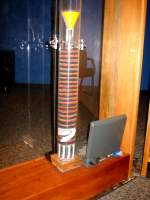
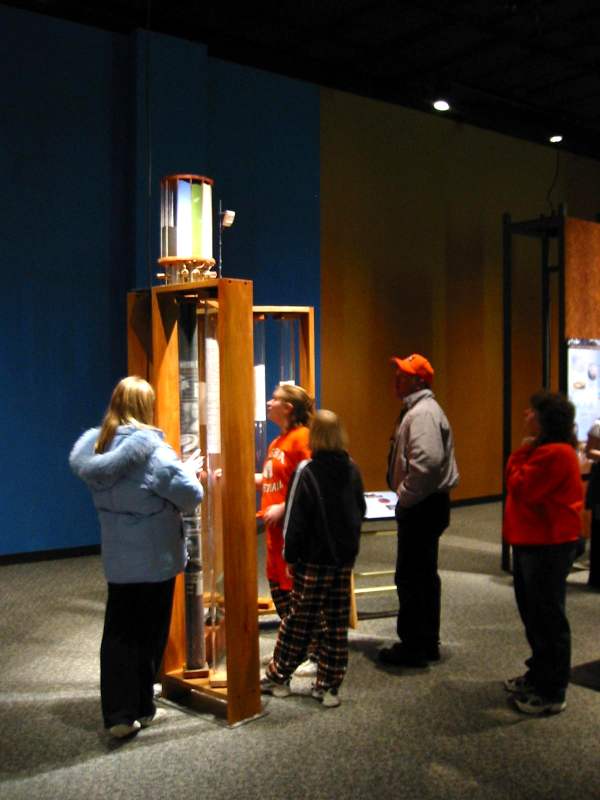
The Stratograph
A kinetic sculpture, and component of the Science Museum of Minnesota's
"Playing With Time" traveling exhibit.
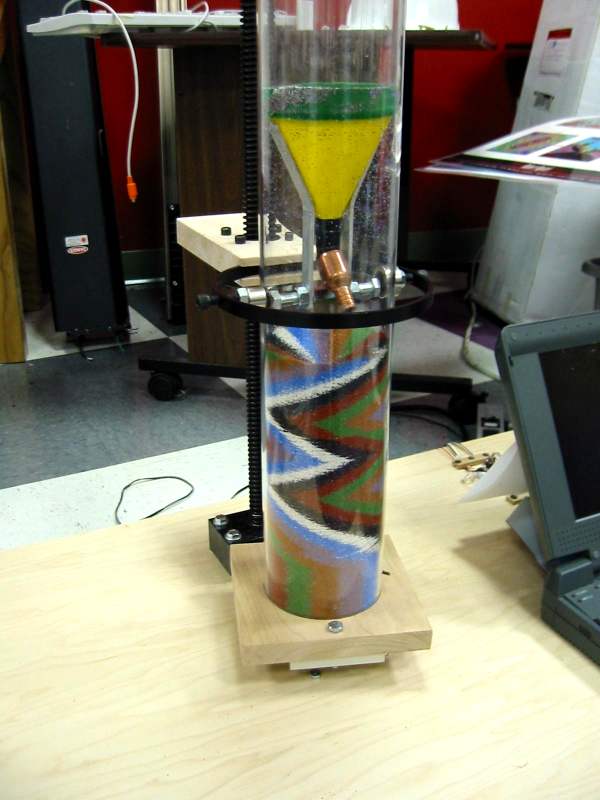
-- Concept: at each venue, the piece creates a "core," a tube
filled with colored sand which is slowly deposited over a 3 month period.
The sand patterns depict both text and graphics relevant to the venue locale,
as well as an actual record in time of a physical phenomenon occurring
within the Stratograph's immediate environment.
June 7, 2002
I met Randy early this morning to change out the completed
tube, and start the second plot. Everything went smoothly, and PWTTUBE1.R8
is underway-- completion date 8/25 (79 days). During the process,
I loaded a newer version of the controlware (strato5.exe) which has some
added error checks (no Z moves, too many Z moves, plot height vs. plot
completion correlation). I also copied the log file from the completed
plot. It shows a faithful recording of
all the sand pixels dropped during the plot (up until the vandal-induced
interruption).
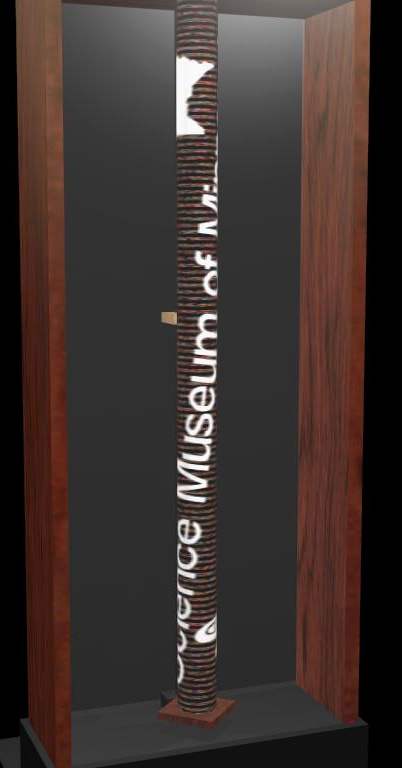
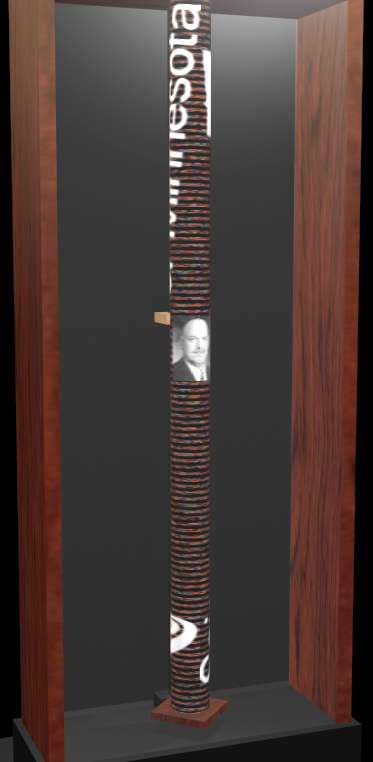
May, 2002
Everything was going well until 5/18, when apparently
a fairly tall visitor decided to vandalize the sand valve assembly by pulling
the spring mount off the black sand valve. This resulted in the
dumping of black sand until the tube was full. I was informed
two days later that the funnel was "buried under sand , and the machine
was not functioning." Although rather annoying, the remedy was simple:
I moved the top assembly, vacuumed the sand above the funnel, thereby freeing
it. After bringing the funnel up and removing it, I could then vacuum
down to the undisturbed level (in Hubert's forehead). This done,
I sent the funnel back down, replaced the head, and loaded up the remaining
portion of the plot (the Minnesota state map).
April, 2002
 _
_ 23
days since the opening, and all is well. Visitors appear to be genuinely
engaged, and despite the lack of finished signage, many seem to be "getting"
it. The only unexpected finding has been that the archived tube has
settled an additional ~1/2"-- undoubtedly due to visitors moving it back
and forth. This raises the need for a threaded plug on the top wood
block, which will allow periodic "topping off" with black sand.
23
days since the opening, and all is well. Visitors appear to be genuinely
engaged, and despite the lack of finished signage, many seem to be "getting"
it. The only unexpected finding has been that the archived tube has
settled an additional ~1/2"-- undoubtedly due to visitors moving it back
and forth. This raises the need for a threaded plug on the top wood
block, which will allow periodic "topping off" with black sand.
March, 2002:
Actualization time:
 Steel
bases and connecting structure cut.
Steel
bases and connecting structure cut.
 Calibrations.
 Opening
day.
Opening
day.
February, 2002:
2/1
 -
-  The
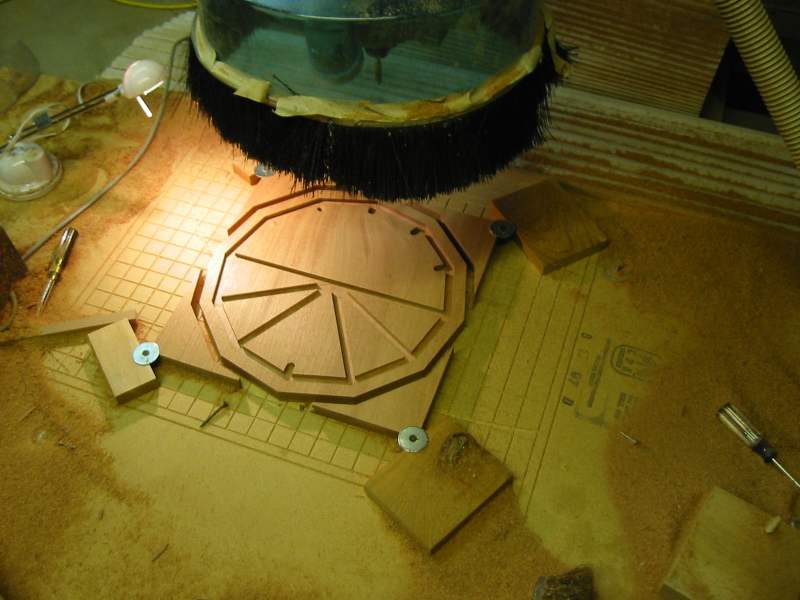
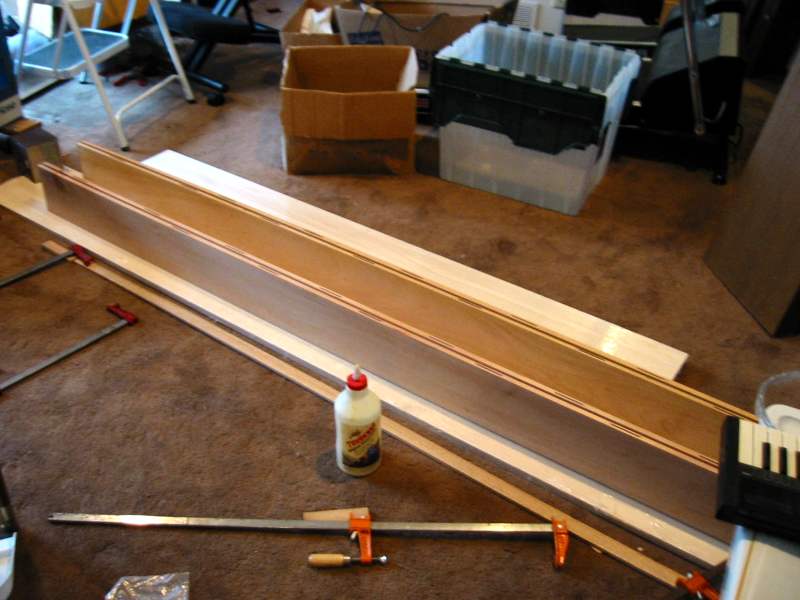
final design of the Stratograph is taking shape, as fabrication begins
with a trip to Youngblood lumber, and the choosing of ~100 board-feet of
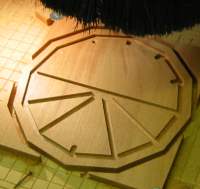
Honduras mahogany. After gluing up the
active chamber's side panels, it was time to refine
some tool paths, and fire up the CNC router-- crucial for the tight
fit needed at the core tubes' ends, as well as the structural
integrity of the sand delivery assembly. Mark Balboa, of Balboa
Plastics, in Richfield, was extremely helpful with the acrylic fabrication--
selling me the small quantity of 1/4" sheet I needed, and lending me a
table saw blade optimized for acrylic.
The
final design of the Stratograph is taking shape, as fabrication begins
with a trip to Youngblood lumber, and the choosing of ~100 board-feet of
Honduras mahogany. After gluing up the
active chamber's side panels, it was time to refine
some tool paths, and fire up the CNC router-- crucial for the tight
fit needed at the core tubes' ends, as well as the structural
integrity of the sand delivery assembly. Mark Balboa, of Balboa
Plastics, in Richfield, was extremely helpful with the acrylic fabrication--
selling me the small quantity of 1/4" sheet I needed, and lending me a
table saw blade optimized for acrylic.
January, 2002:
1/19
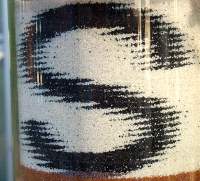
 It's
been about 3 weeks since "on the floor" testing began. Overall, the
Stratograph's behavior has been as I expected. And the response has
been good. The last run was an attempt to reproduce the Vikings and
Twins' logos. The relative success
and failure give me a good clue as to the
necessary size required for clear recognizability. Testing has provided
much useful information-- and produced an interesting
totem.
It's
been about 3 weeks since "on the floor" testing began. Overall, the
Stratograph's behavior has been as I expected. And the response has
been good. The last run was an attempt to reproduce the Vikings and
Twins' logos. The relative success
and failure give me a good clue as to the
necessary size required for clear recognizability. Testing has provided
much useful information-- and produced an interesting
totem.
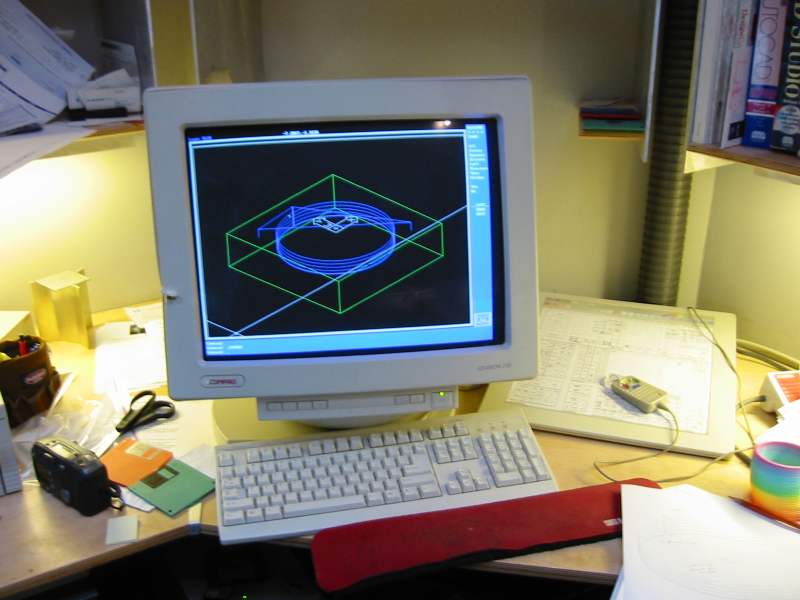
1/11
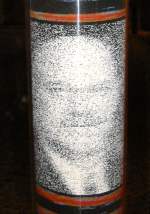
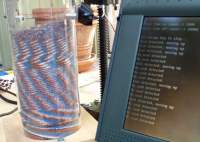
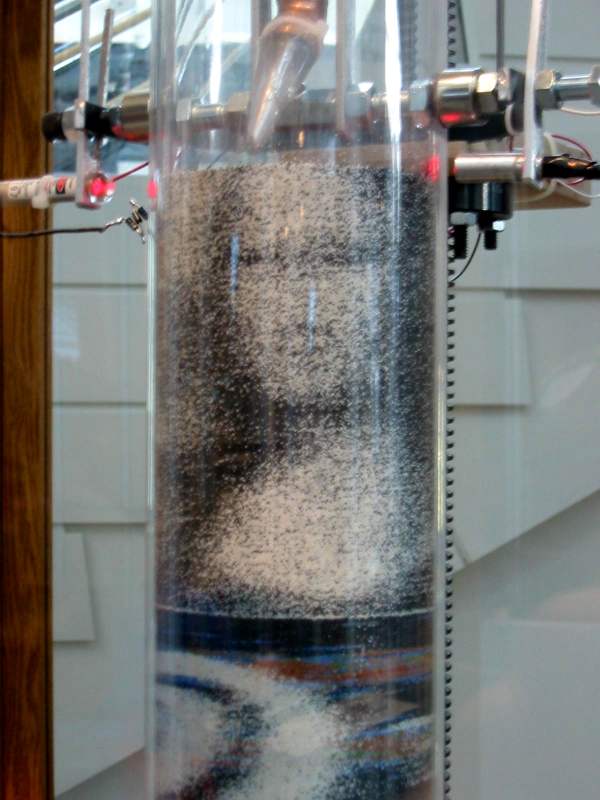
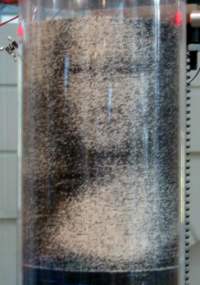 Mona's
almost complete (laptop screen shot).
She's a bit fuzzy, but still recognizable-- especially
from
afar. This suggests that faces will need to fill at least 150x
150 or so pixels to be recognizable. The motion sensor recording
continues
to function well.
Mona's
almost complete (laptop screen shot).
She's a bit fuzzy, but still recognizable-- especially
from
afar. This suggests that faces will need to fill at least 150x
150 or so pixels to be recognizable. The motion sensor recording
continues
to function well.
1/9
Front:
Back:
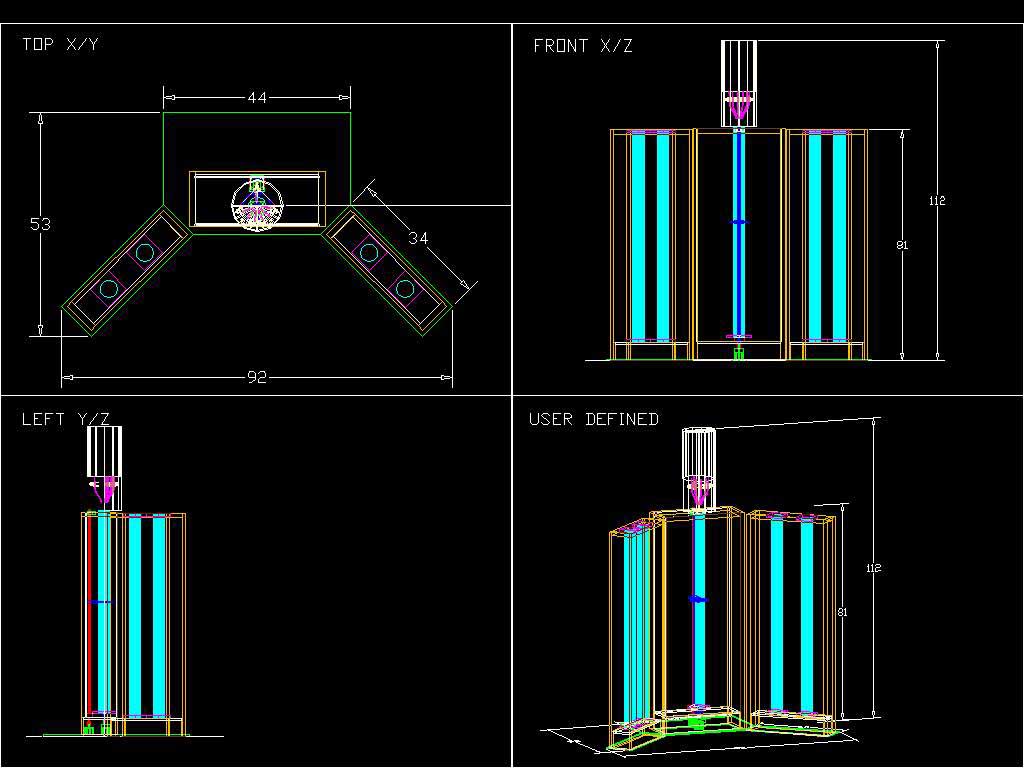
 CAD
drawing
CAD
drawing
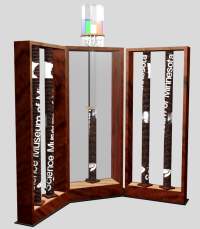
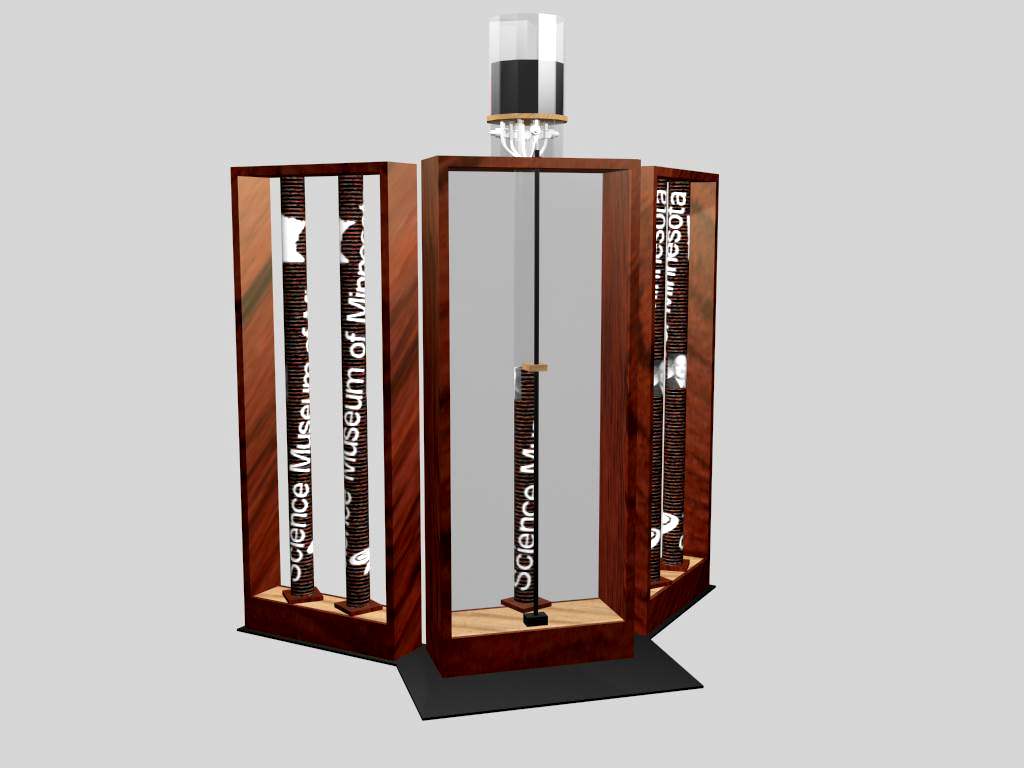
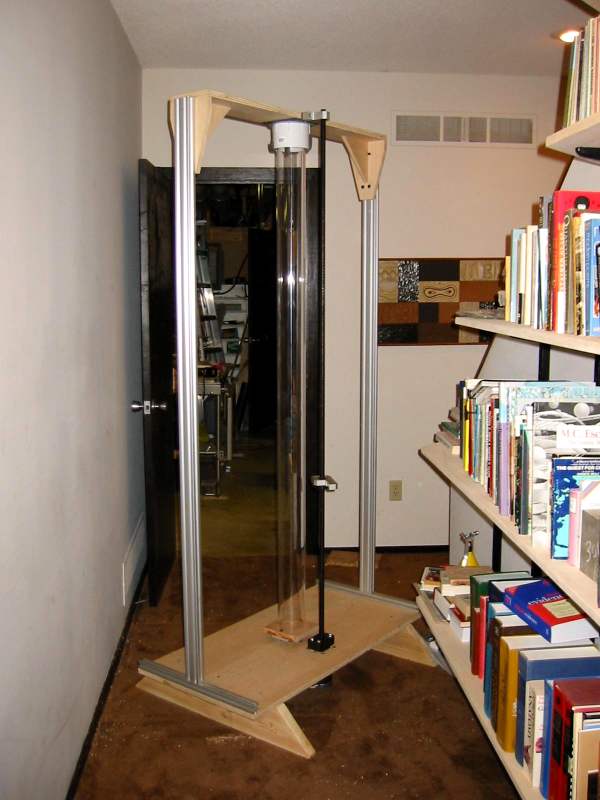
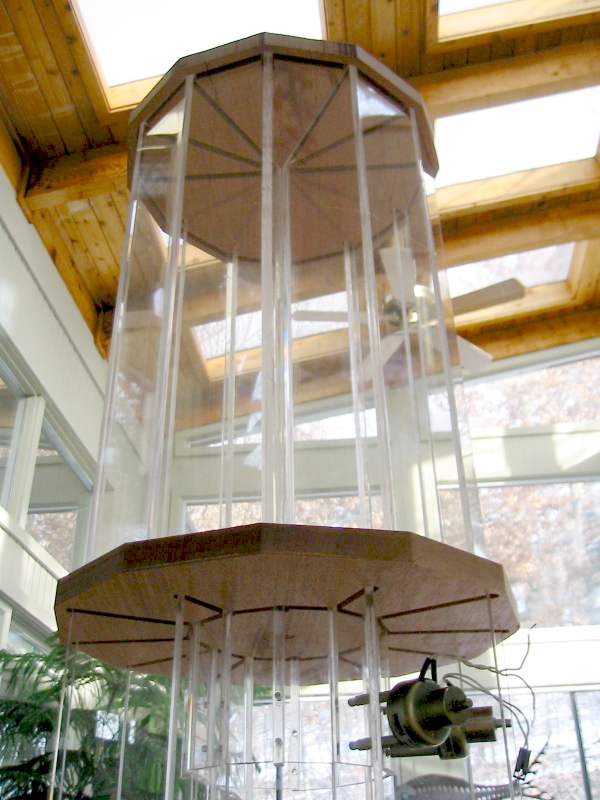
The final form of the piece is taking shape.
Features of this design:
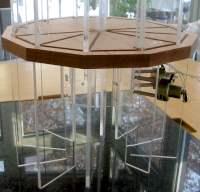
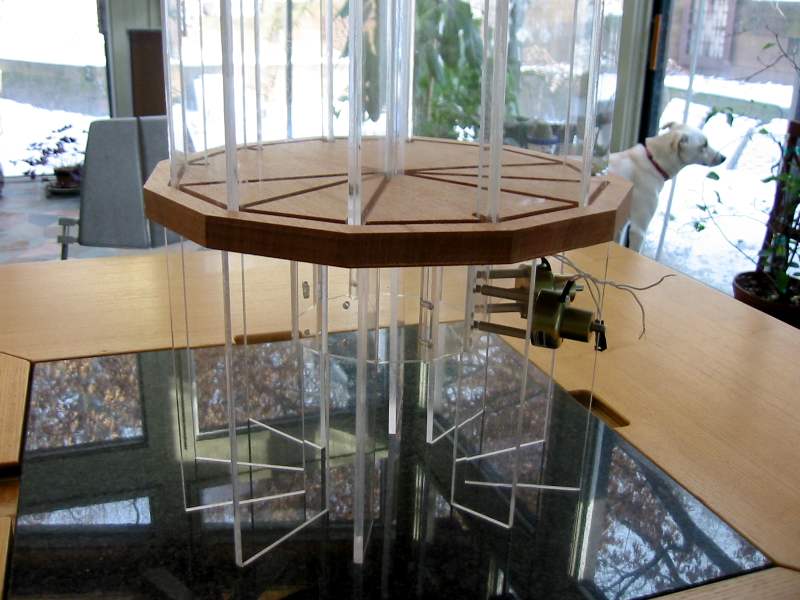
By utilizing two "display wings," the active center chamber
is stabilized without the need for a floor plate extending under the viewing
area directly in front.
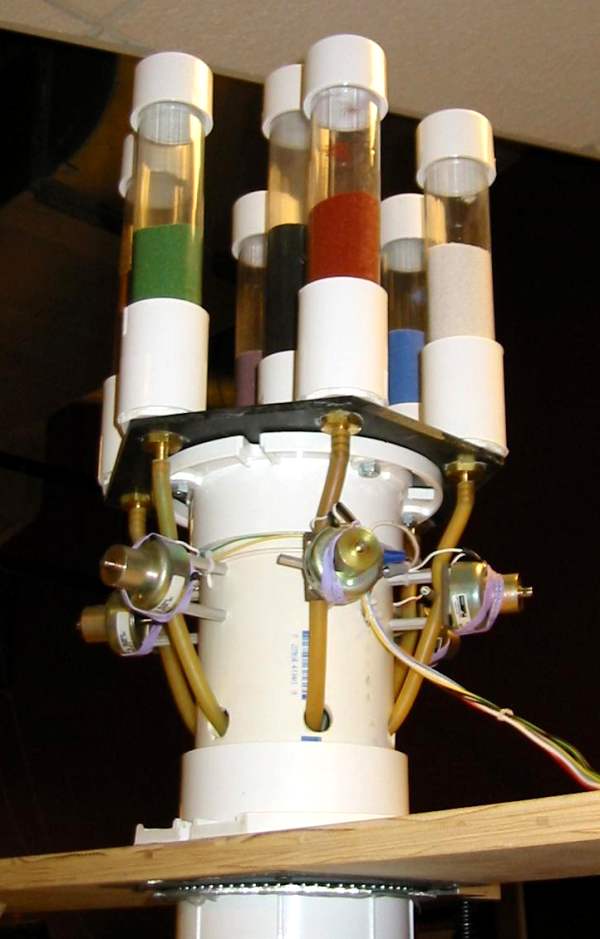
The center chamber is enclosed by acrylic sheets front and
back; the four archived tubes are mounted on lazy-susans, allowing viewers
to handle and examine them.
The entire sculpture will disassemble into four main pieces:
The center chamber + steel base (1/4" thick), the two wings and their bases,
and the top reservoir assembly.
The CAD drawing lists pertinent dimensions. The
renderings are intended to give a feel for the overall appearance of the
completed work, but to save time I did not create different maps for the
archived tubes, or try to finesse the appearance of the wood grain.
Despite the light wood materials used throughout the exhibit, I have chosen
a dark hardwood (Honduras mahogany) for a variety of reasons-- both practical
and aesthetic.
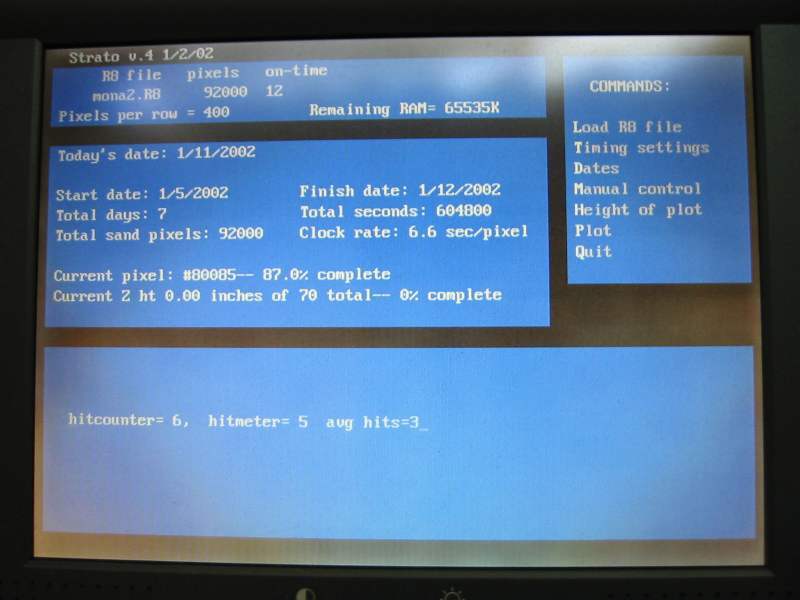
1/8
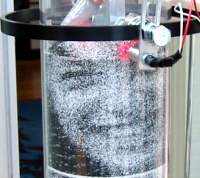
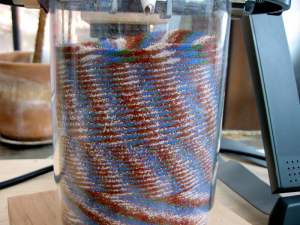
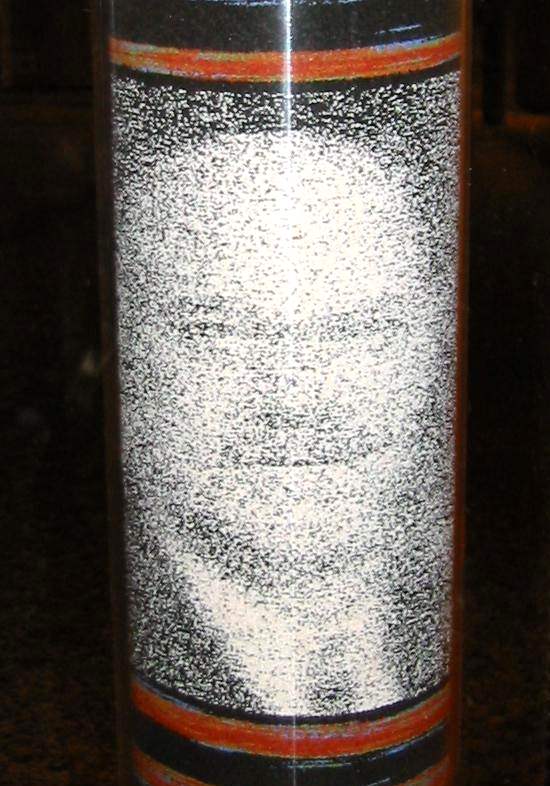
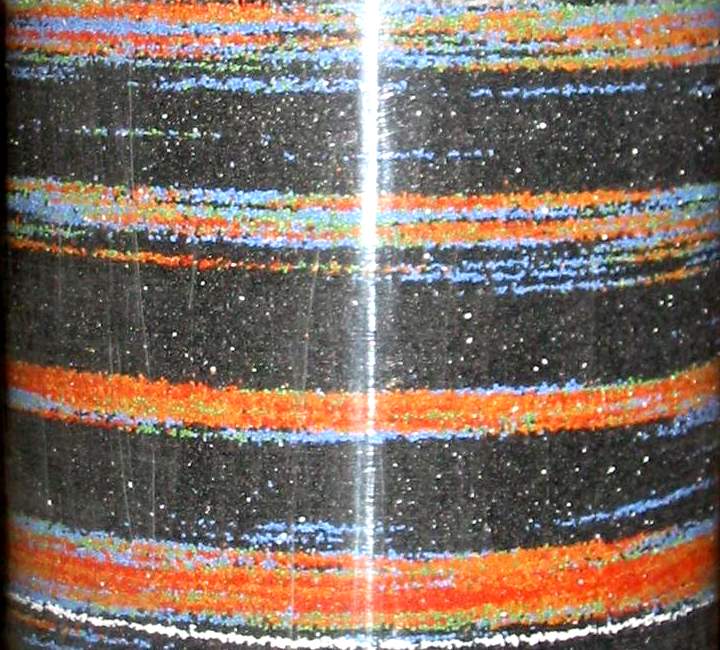
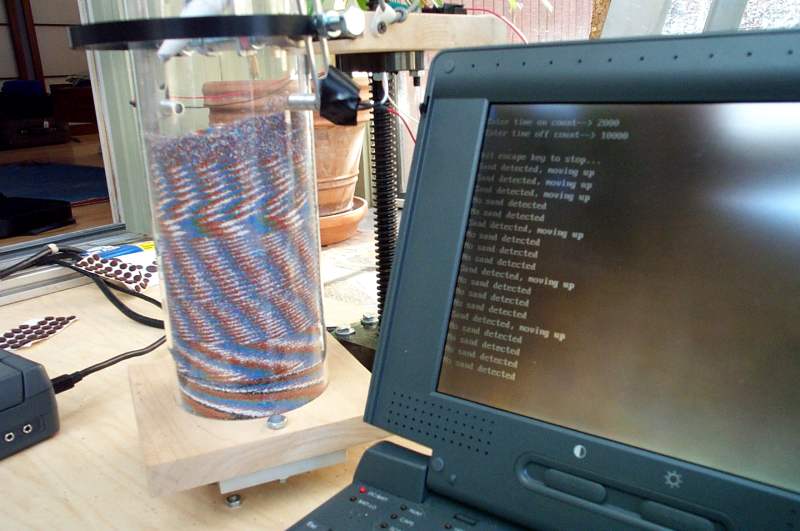
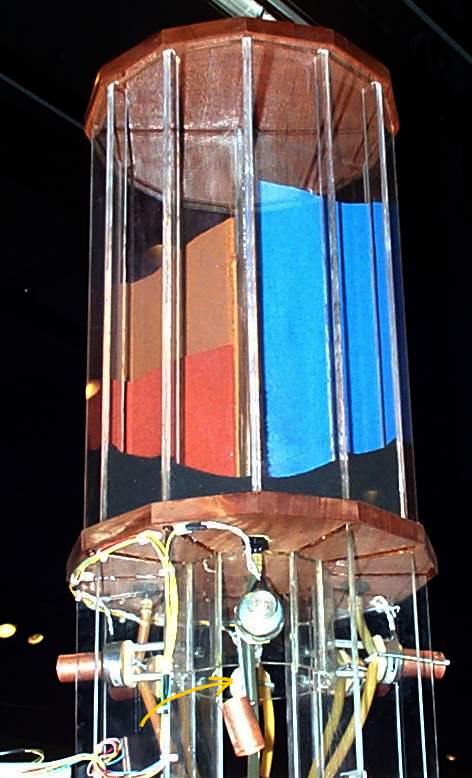
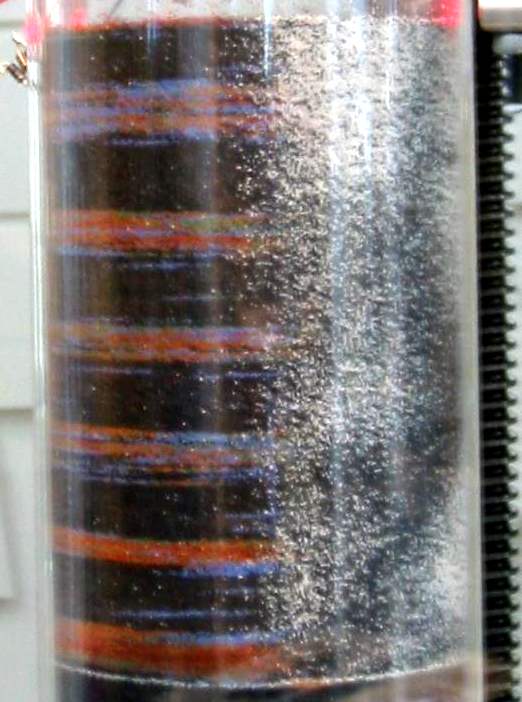
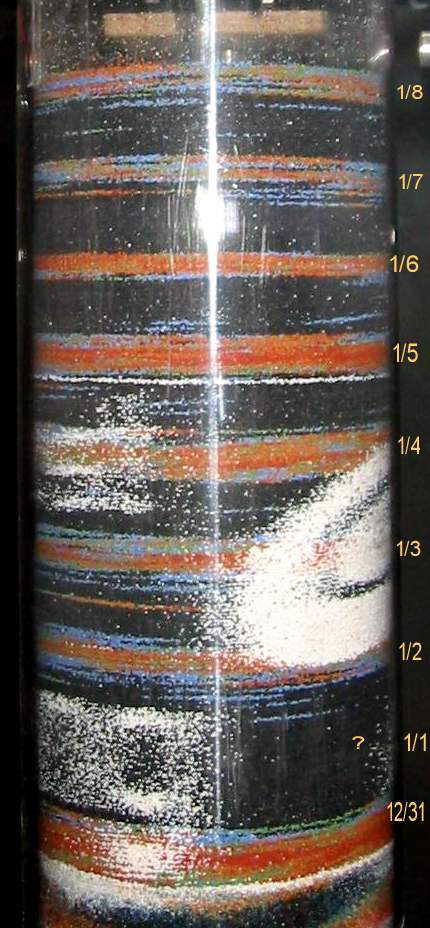
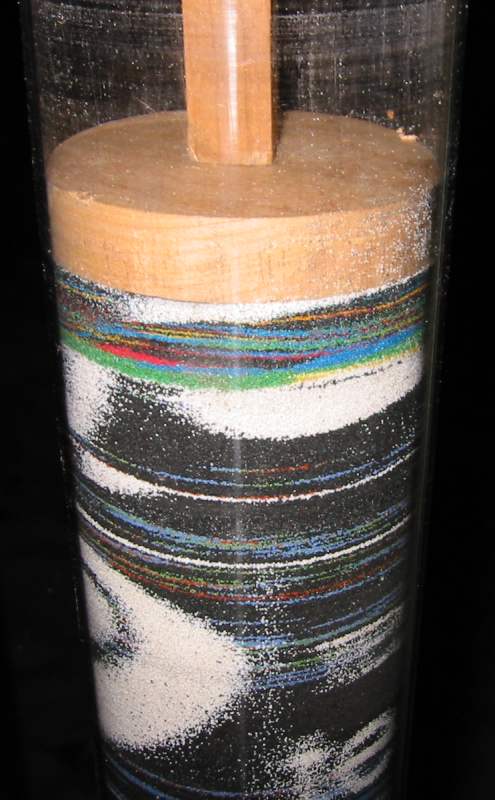
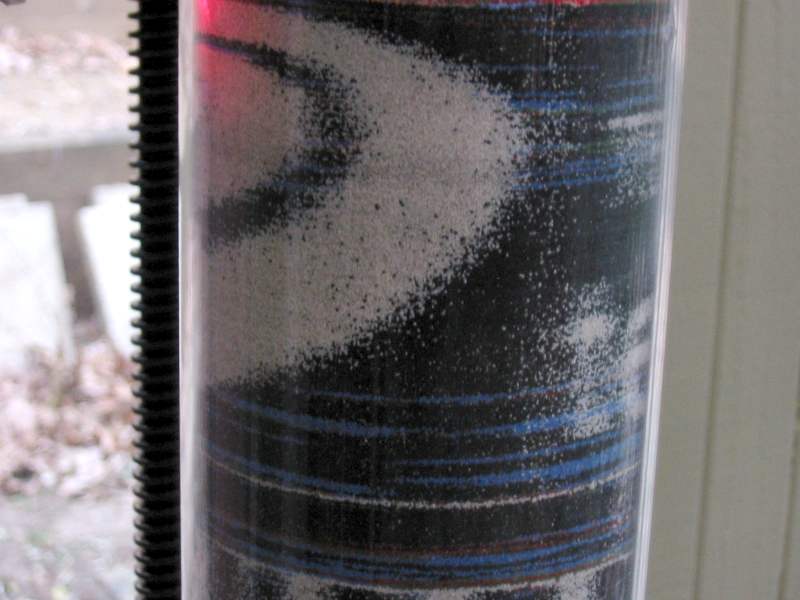
 Since
changing back to the 3M aggregate on 12/29, the Stratograph has been steadily
dropping sand at a rate of every ~7 seconds-- the actual rate which will
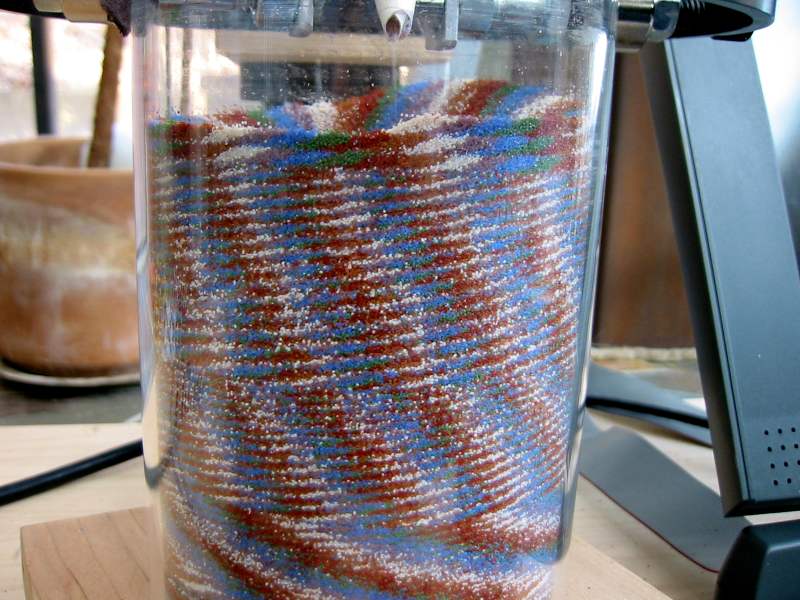
fill a core tube in 3 months time. For the most part, its behavior
has been what I expected-- nightly black bands, interlaced with daily activity
records. Close inspection of the record reveals some interesting
findings-- one of which is that the occasional blue bands seen during the
middle of the night are likely due to a late night cleaning crew.
One glitch which I believe is related to a timing routine error on my part
(since corrected) resulted in the complete absence
of activity recording during New Year's Day. No problems since
the fix. Today, the Stratograph is about midway through a plot of
the Mona Lisa (on the flip side of the activity record) -- expected to
be complete on 1/12.
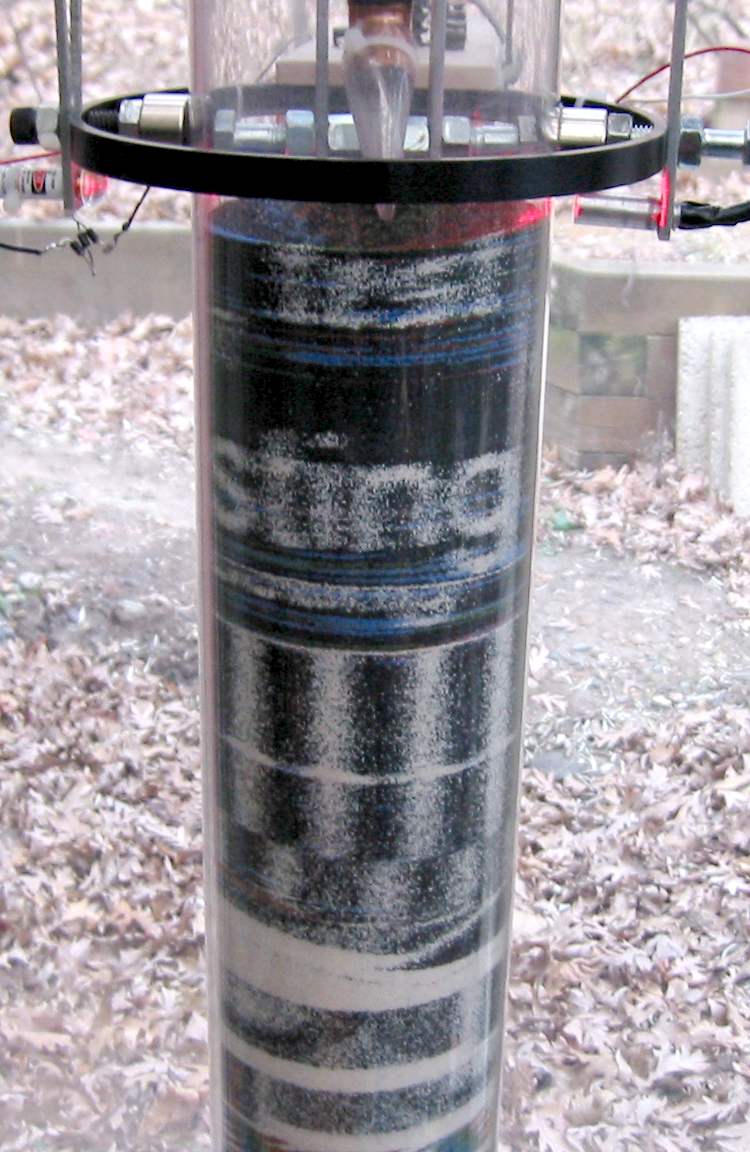
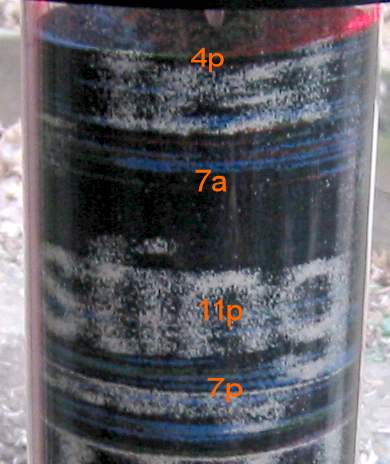
Since
changing back to the 3M aggregate on 12/29, the Stratograph has been steadily
dropping sand at a rate of every ~7 seconds-- the actual rate which will
fill a core tube in 3 months time. For the most part, its behavior
has been what I expected-- nightly black bands, interlaced with daily activity
records. Close inspection of the record reveals some interesting
findings-- one of which is that the occasional blue bands seen during the
middle of the night are likely due to a late night cleaning crew.
One glitch which I believe is related to a timing routine error on my part
(since corrected) resulted in the complete absence
of activity recording during New Year's Day. No problems since
the fix. Today, the Stratograph is about midway through a plot of
the Mona Lisa (on the flip side of the activity record) -- expected to
be complete on 1/12.
December, 2001:
Dec. 31
Stopped by the Museum this morning, and found that the
theta axis set screw had worked its way loose sometime last night.
So, while the theta motor was working fine, the tube was not rotating.
Also, found that the new, fine sand was sticking to the sides of the core
tube, and was prone to producing an uneven sand layer. Decided
to return to the 3M aggregate-- loaded the reservoir tubes, and started
testpat.r8 (60,000 pixels) over again. Should complete on 1/4/02.
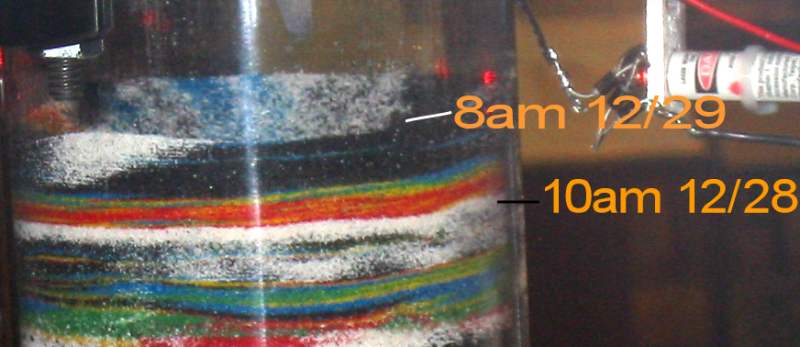
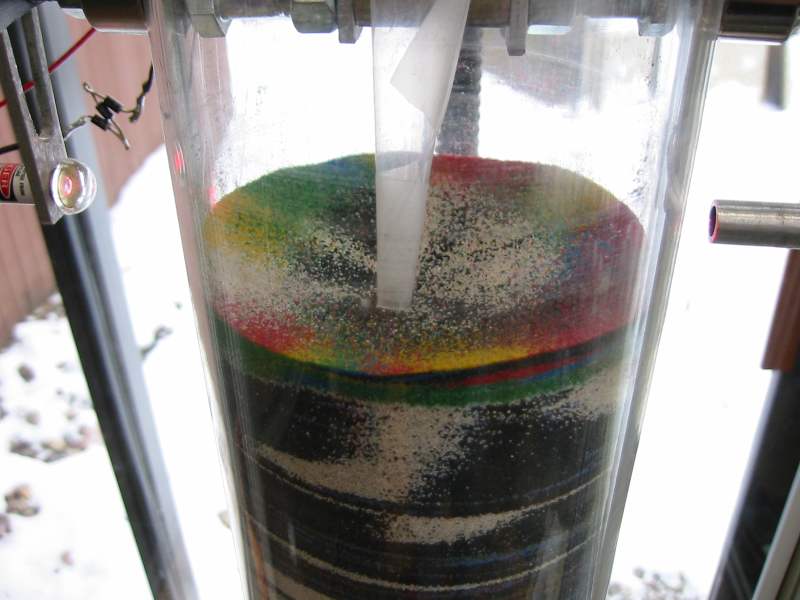
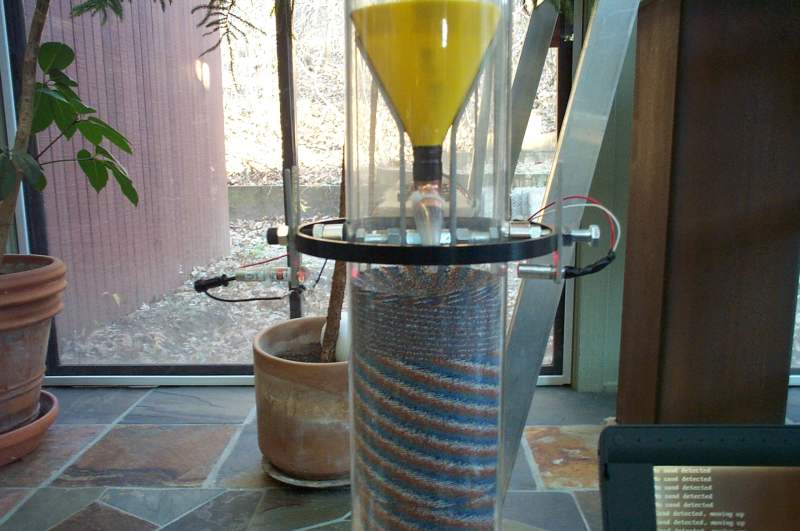
Dec. 29
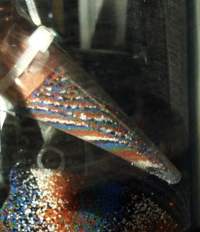
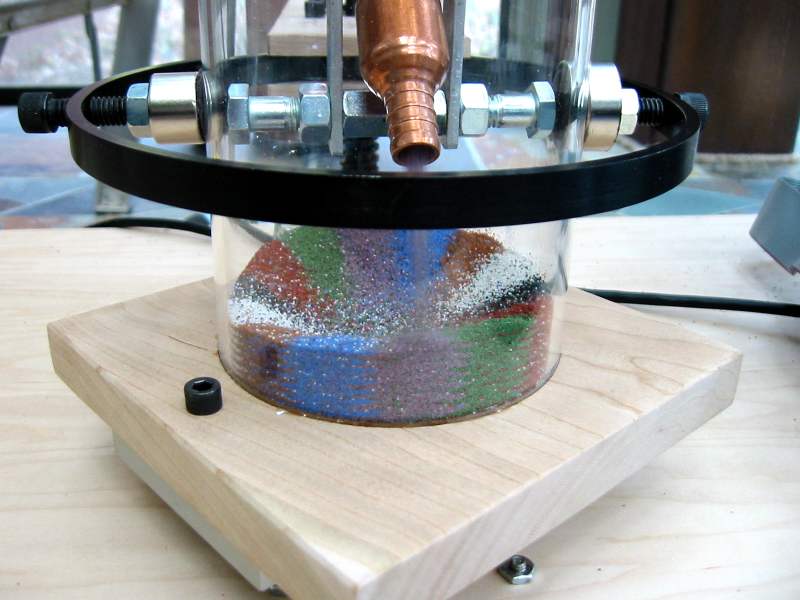
 The
first day's worth of data recording shows pretty much what I expected--
about 3/4" of added height, with lots of red during the early part of the
day, tapering to green and blue, then black over night.
The
first day's worth of data recording shows pretty much what I expected--
about 3/4" of added height, with lots of red during the early part of the
day, tapering to green and blue, then black over night.
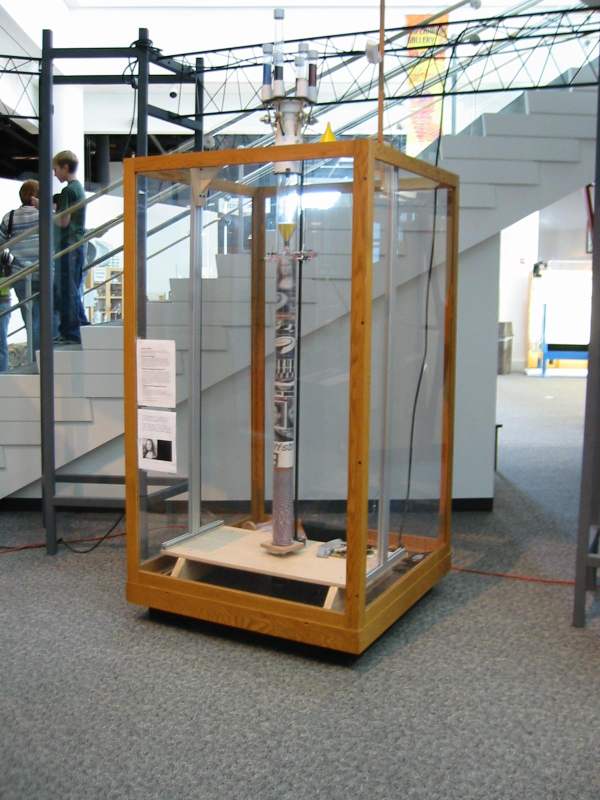
Dec. 28
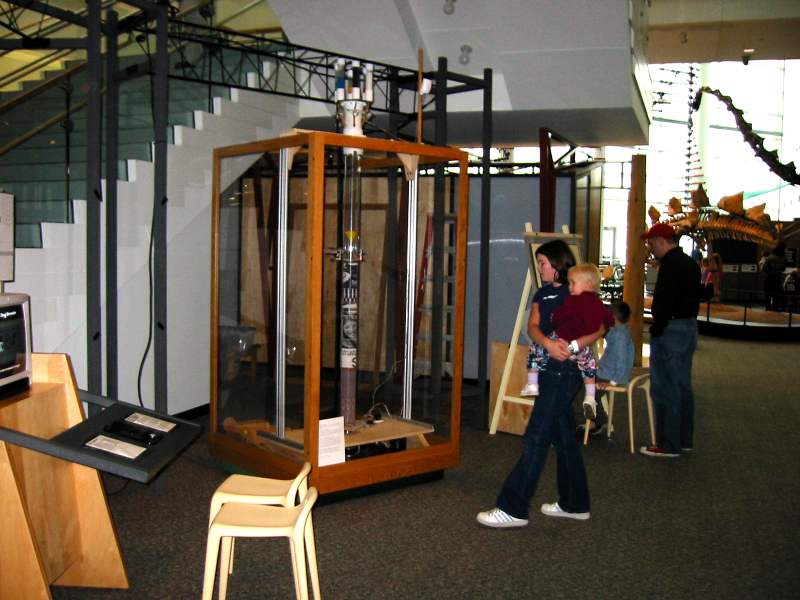
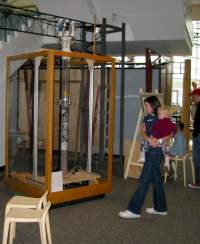 The
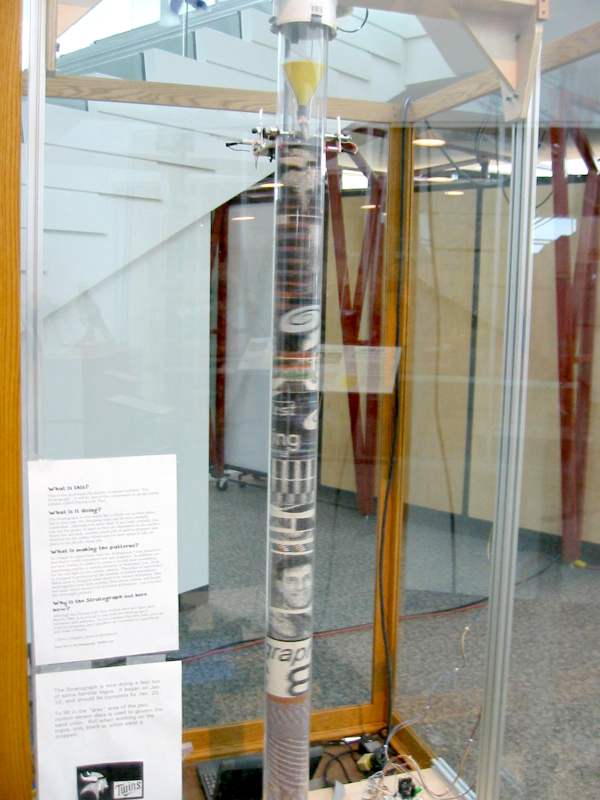
prototype is up and running at the Museum, as of this morning. Using
the protective display case that Dan was able to dig up, it is nestled
under the staircase on level 3, facing the main thoroughfare to "the bones"
(paleo). I met with Dan, Randy, Russ and Richard and explained the
key features of operation. To begin with, we will use a small test
image (testpat3.r8, which contains the Museum logo), and spread it over
5 days. This is approximately the same rate that would fill the entire
tube in 3 months. The Museum is packed with holiday visitors today,
and I anticipate a fair amount of red sand. The PIR sensor is currently
located about 8' up, and looks down and in front of the case.
The
prototype is up and running at the Museum, as of this morning. Using
the protective display case that Dan was able to dig up, it is nestled
under the staircase on level 3, facing the main thoroughfare to "the bones"
(paleo). I met with Dan, Randy, Russ and Richard and explained the
key features of operation. To begin with, we will use a small test
image (testpat3.r8, which contains the Museum logo), and spread it over
5 days. This is approximately the same rate that would fill the entire
tube in 3 months. The Museum is packed with holiday visitors today,
and I anticipate a fair amount of red sand. The PIR sensor is currently
located about 8' up, and looks down and in front of the case.
Dec. 26-27
 Continued
testing of the PIR sensor and new software changes. Also, samples
of colored sand from Dick Blick's web store
have arrived. They carry a wide variety of brightly colored sands,
and the price is not dramatically more than the 3M aggregate. It
is, however, much finer-- which may add to the resolution capabilities,
but definitely makes it more difficult to actually see the sand come out
of the spout.
Continued
testing of the PIR sensor and new software changes. Also, samples
of colored sand from Dick Blick's web store
have arrived. They carry a wide variety of brightly colored sands,
and the price is not dramatically more than the 3M aggregate. It
is, however, much finer-- which may add to the resolution capabilities,
but definitely makes it more difficult to actually see the sand come out
of the spout.
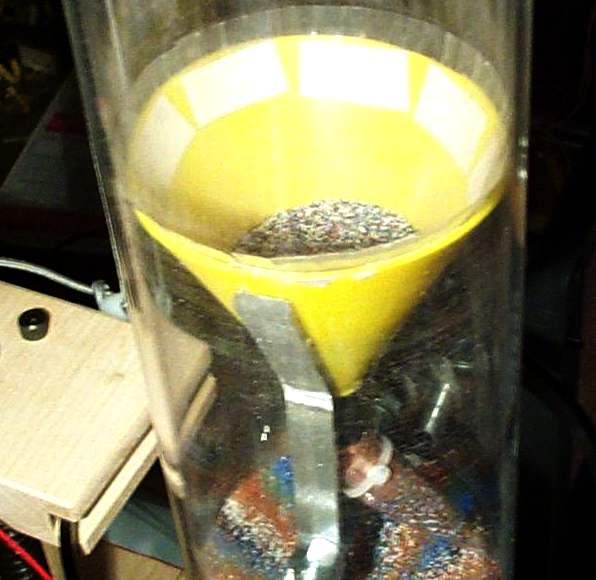
In order for me to transport the Stratograph to the Museum,
without spilling the first tube's sand, I have fashioned a plunger.
It appears to work just fine.
Dec. 19-21
 _
_  Focus
has turned toward a major overhaul of the Stratograph software. I've
run into several annoying bugs-- from simple oversights, to subtle problems
dealing with numerous timing routines. As always,
the
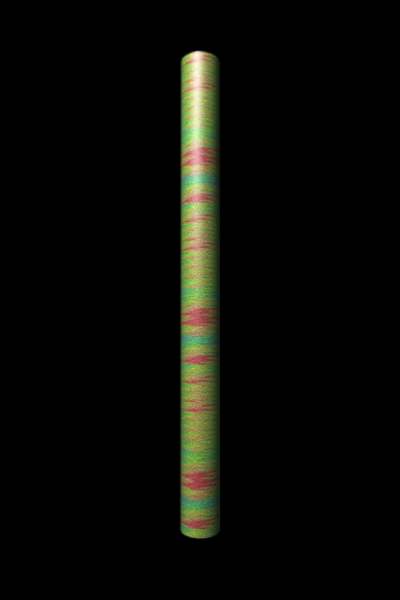
sand records my progress (or lack thereof). My first attempt
at mapping motion detector data to colors turned out to be too insensitive
(mostly black). The scheme I am now using (strato4.exe) produces
more color deposition. It is difficult to mimic random visitor motion.
I tried locking my dogs in the room when I was out, but it appears that
they both took naps (lots of blue and black). Close
inspection does reveal a correlation between inactivity and night--
in this case, the nocturnal black band is about 4x thicker than would be
expected in an actual 3 month plot, since I am running at about 4x speed).
As expected, text and graphic quality are
far better when reproducing horizontal lines than vertical.
Focus
has turned toward a major overhaul of the Stratograph software. I've
run into several annoying bugs-- from simple oversights, to subtle problems
dealing with numerous timing routines. As always,
the
sand records my progress (or lack thereof). My first attempt
at mapping motion detector data to colors turned out to be too insensitive
(mostly black). The scheme I am now using (strato4.exe) produces
more color deposition. It is difficult to mimic random visitor motion.
I tried locking my dogs in the room when I was out, but it appears that
they both took naps (lots of blue and black). Close
inspection does reveal a correlation between inactivity and night--
in this case, the nocturnal black band is about 4x thicker than would be
expected in an actual 3 month plot, since I am running at about 4x speed).
As expected, text and graphic quality are
far better when reproducing horizontal lines than vertical.
Tentative plan is to set up the prototype at the Museum
next week.
Dec. 13-14
 After
destroying two $7 security lights from Home Depot without much success,
I was able to hack into the circuitry of
a PIR security module being sold at AxMan for $10. Two of the three
PIR devices I ordered from MPJA arrived on 12/12-- far easier to deal with!
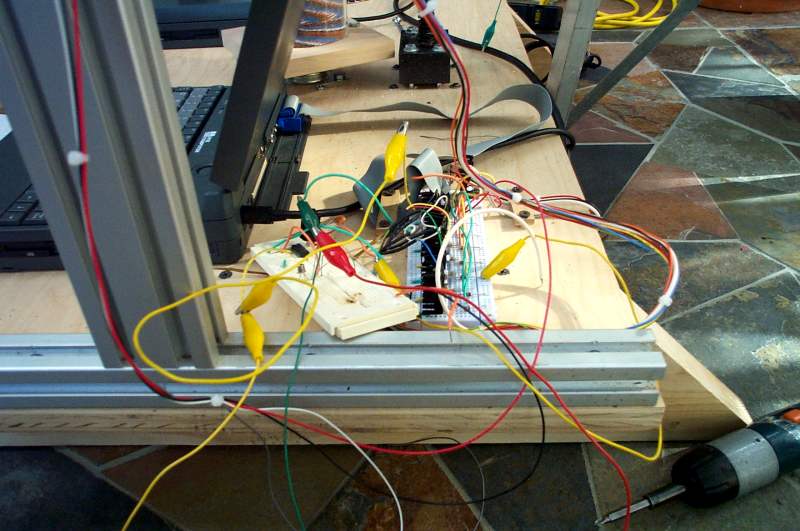
I spent most of yesterday writing a program that will allow testing and
logging of the "hit rates" form three sensors simultaneously. I had
two sensors hooked up (AxMan's, and MPJA-1) by 10pm and started recording.
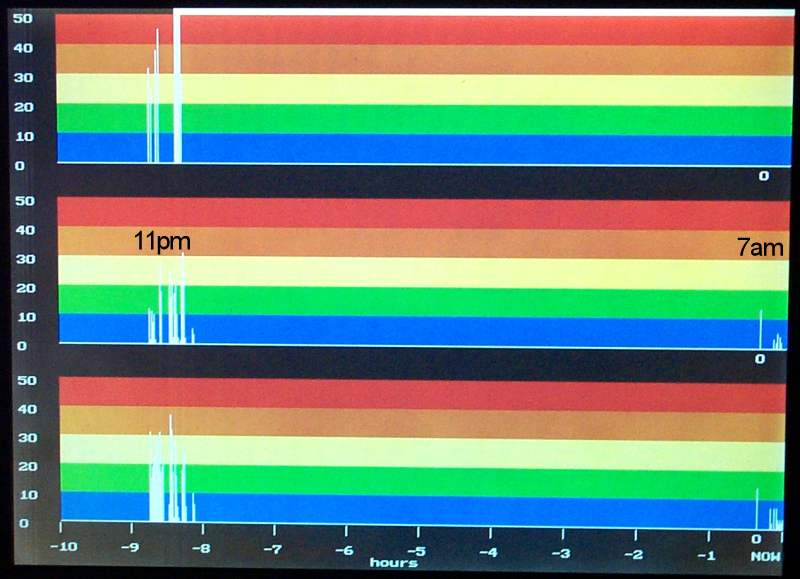
The "triple chart" shows the motion detection hit rates for these two (
the top chart is me messing with the unconnected input wire for sensor
#3). As expected, both sensors remained unactivated over night, until
this morning. The vertical scaling numbers refer to the number of
times per minute that the sensor was activated (the software checks the
status every second). Each PIR module has different latency times--
hence, although 60 hits / minute is the absolute max-- far lower numbers
are expected, even when there is relatively constant motion in the sensing
area. Each vertical bar (one pixel wide) represents 1 minute.
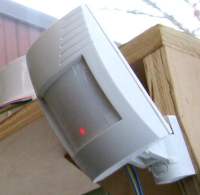
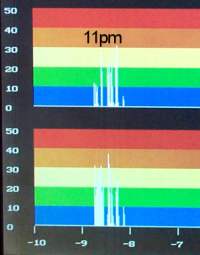
After
destroying two $7 security lights from Home Depot without much success,
I was able to hack into the circuitry of
a PIR security module being sold at AxMan for $10. Two of the three
PIR devices I ordered from MPJA arrived on 12/12-- far easier to deal with!
I spent most of yesterday writing a program that will allow testing and
logging of the "hit rates" form three sensors simultaneously. I had
two sensors hooked up (AxMan's, and MPJA-1) by 10pm and started recording.
The "triple chart" shows the motion detection hit rates for these two (
the top chart is me messing with the unconnected input wire for sensor
#3). As expected, both sensors remained unactivated over night, until
this morning. The vertical scaling numbers refer to the number of
times per minute that the sensor was activated (the software checks the
status every second). Each PIR module has different latency times--
hence, although 60 hits / minute is the absolute max-- far lower numbers
are expected, even when there is relatively constant motion in the sensing
area. Each vertical bar (one pixel wide) represents 1 minute.
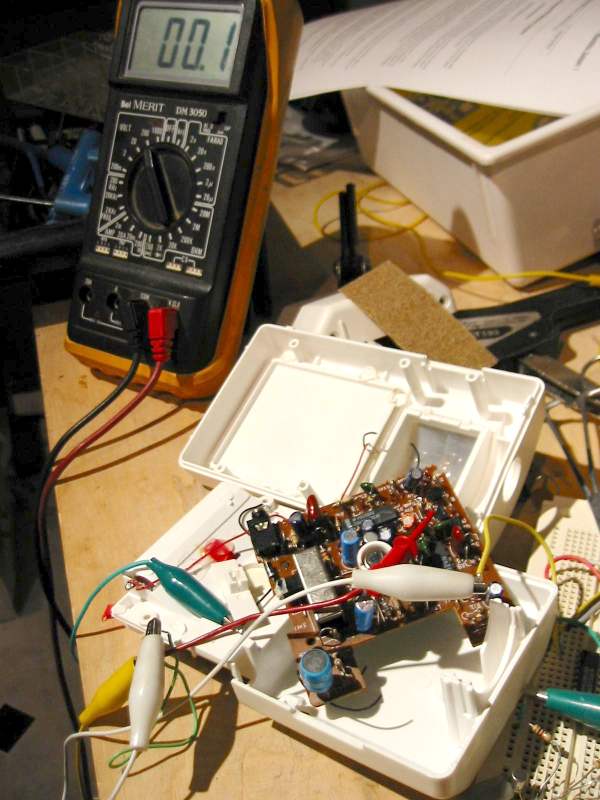
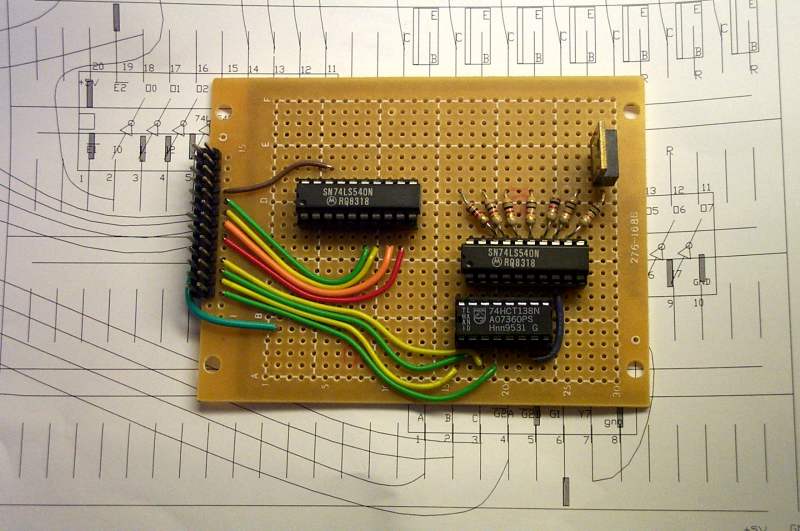
Dec. 10
 Finalizing
design of top assembly. CAD layout.
Also, finalizing electronics: schematic,
PCB
layout, circuit board under construction.
Finalizing
design of top assembly. CAD layout.
Also, finalizing electronics: schematic,
PCB
layout, circuit board under construction.
Awaiting PIR sensor from MPJA-- should be here tomorrow.
Dec. 5
Conference call with Robert, Katrina, Bob and myself--
"Plan A" (multiple buttons corresponding to sand colors as input) vs. "plan
B" (single button or sensor, sand color related to "hit rate") discussed.
Plan B favored. Sensor (passive detection) vs. active input-- passive
favored. Will proceed with current plans to use 24 hr/day, metronomic
sand drops.
Have begun to experiment with PIR sensors. Bought
a $7 security light at Home Depot, and hacked the sensor board.
Have ordered a variety of PIR
modules from Marlin P. Jones, but the bare sensor is on back order.
Also, have found a couple articles on hacking this sensor --
Jack Dollhausen's; Seattle
Robotics'
Dec. 3


 Rendered tube front, back,
animation
(682K mov)
Rendered tube front, back,
animation
(682K mov)
After much thought, have decided to try going back to
an interactive approach for the "data driven" aspect. Key reasons:
-
Use of archived temperature data is not as "natural" as recording
phenomena from local environment.
-
Aesthetic promise of temperature data questionable.
-
lack of interaction at night will create recognizable, and
visually pleasing, bands representing a 24 hour period.
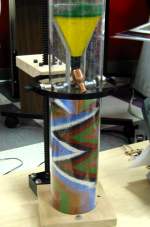
Schema:
Each venue will have its own "template" of preordained
sand pixels. These will include the site's name, logo, and bitmaps
of locally recognizable shapes and faces. These pixels (composed
of black and white sand) cannot be changed by interaction, but will comprise
the minority of the filled tube's pixels. Non-preordained pixels
can be modified by visitor interaction as follows: there will be
buttons (one for each sand color other than B & W) which the visitor
can push. If button #1 is pushed, color #1 is added to the "queue"
The queue is a portion of a computer monitor which is visible through a
rectangular porthole, and is composed of colored "bricks." Every
6 to 7 seconds, a sand pixel is released-- the sand color is governed by
the color at the bottom of the queue. If nobody interacts with the
buttons, the queue stays filled with black "bricks." Interaction
with the buttons replaces the black bricks with chosen colored bricks.
After each sand pixel drop, the bottom brick disappears, and the stack
of bricks moves down one. If the visitor interacts "vigorously" with
the buttons, then the queue fills to some maximum value, and will not accept
any more bricks, until a sand pixel is dropped-- freeing up one slot.
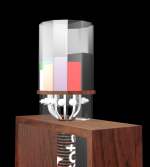
Visualization images above, while crude, give at least
some idea of what the filled tube will look like. In this case, interactive
sand pixel colors were chosen randomly, with random repeats. The
palette is my best approximation of the five non-black/white 3M sands that
I have:  .
.
The visualizations do not yet show the "queue," the sand
valves and storage on top, or the interactive input buttons. Also,
to be added are the archived tubes from prior venues on display.
Assuming: Tube length
of 72", 100 day duration, 24 hr/day operation, similar sandpixel size to
what I've been doing (12ms open time)--
Time
between pixels = 6.7 sec.
3/4"
/ day
13000
pixels / day
400
pixels per rotation (row)
32
rows / day
1.3
megapixels / venue -- (entire record would fit nicely on a floppy)
November, 2001:
Nov. 26
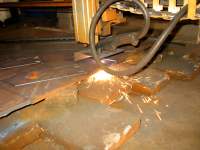
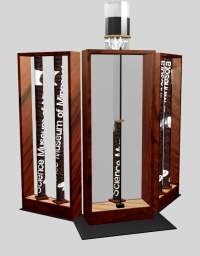
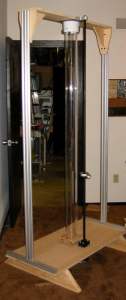
 A
key point in contemplating the building a second stratograph, is the final
form of the traveling unit. From the meeting on 11/19, we have decided
to pursue a "monolithic" strategy-- the tube and all moving parts will
be encased in acrylic. I've begun to visualize this design-- the
base will be fabricated from 1/2" steel, and will weigh ~300lbs, as shown.
The sides and top are 1.5" Honduras mahogany. The front and back
acrylic panes are 1/4".
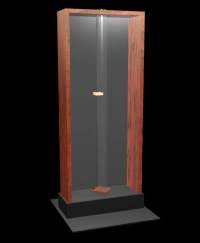
A
key point in contemplating the building a second stratograph, is the final
form of the traveling unit. From the meeting on 11/19, we have decided
to pursue a "monolithic" strategy-- the tube and all moving parts will
be encased in acrylic. I've begun to visualize this design-- the
base will be fabricated from 1/2" steel, and will weigh ~300lbs, as shown.
The sides and top are 1.5" Honduras mahogany. The front and back
acrylic panes are 1/4".
Nov. 20
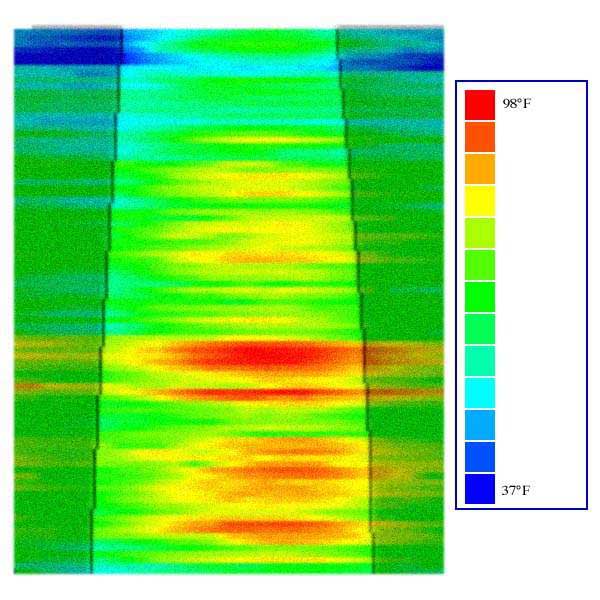
 An
example of Bob's early experiments with visualizing data (in this case,
temp and daylight hours). Also, a rendering
of the pattern mapped upon a cylinder.
An
example of Bob's early experiments with visualizing data (in this case,
temp and daylight hours). Also, a rendering
of the pattern mapped upon a cylinder.
Nov. 19
Met with Robert, Dan and Katrina at my place, while stratograph
continued to drop sand. Salient points:
-
Robert raised the importance of a "data-driven" aspect to
the piece as a direct link to the idea that there is a direct connection
to time. We all agreed. One potential strategy would be to use half
the tube for this, and half for text or bitmap information.
-
One potential source of data could be weather-- temp and
precip. We could use almanac data (Katrina), to avoid real time data
entry compliance issues.
-
We'll try to test various strategies using the visualizing
tools Bob is developing.
-
The favored barrier system for the final version has shifted
from a railing system to acrylic / glass plates in front and behind that
will allow viewers a closer look.
-
Dan would like to get the prototype out on the floor as soon
as possible. I agree-- but want to make sure we can test pattern
ideas quickly. I am considering the possibility of building
a second machine.
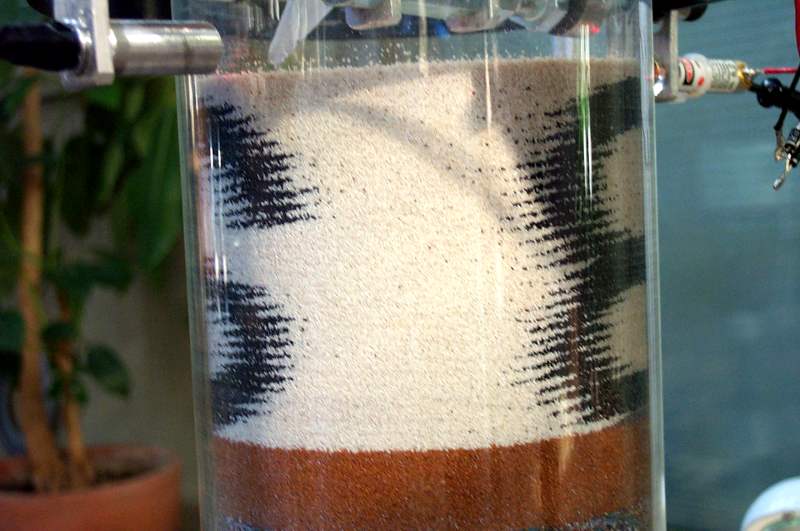
Nov. 13
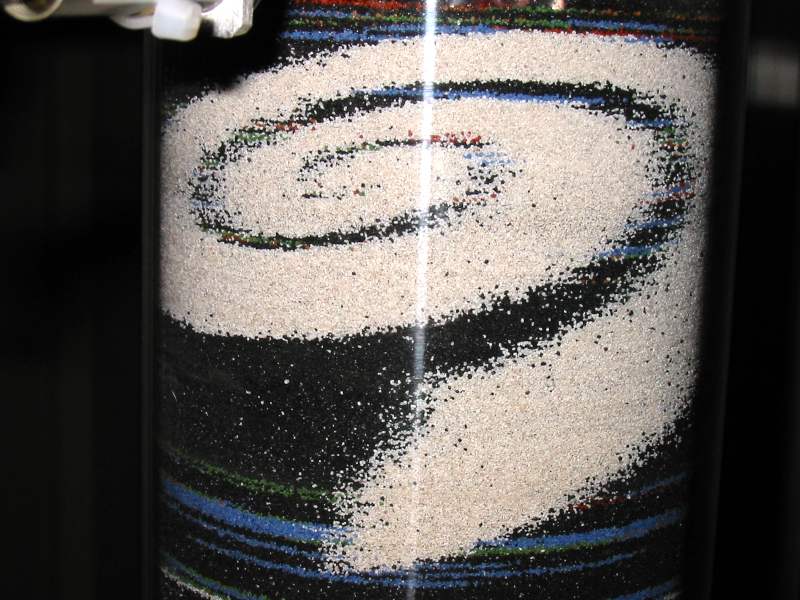
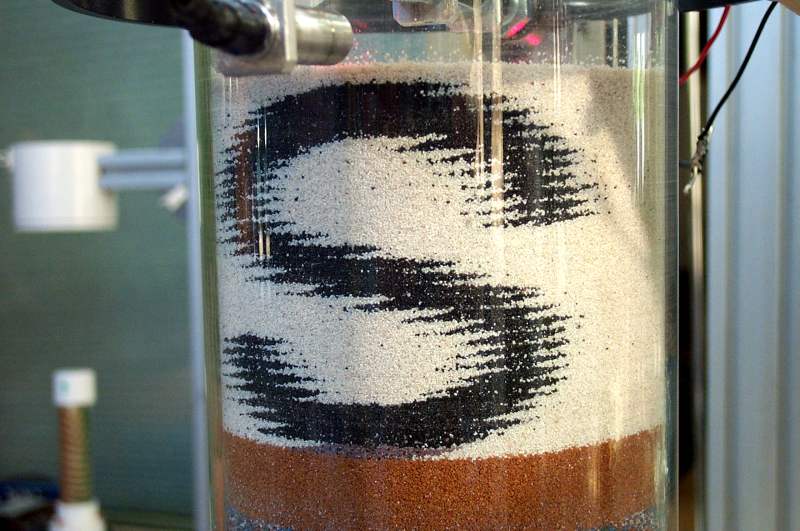
 Spurred
on by the successes with simple text, I turned to the next level of complexity.
Choosing simple images of my daughter's face and my own, I attempted to
do them in sand. Unfortunately, I had made a small (but dumb) error
in my program, which caused a slight shift in alignment with each row.
I discovered the error upon awaking (11/11) and finding what I hoped would
be faithful renditions, smeared to the left. After correcting this
bug, I began again. Now 28 hours into what will be a 41 hour plot,
the results are telling.
Spurred
on by the successes with simple text, I turned to the next level of complexity.
Choosing simple images of my daughter's face and my own, I attempted to
do them in sand. Unfortunately, I had made a small (but dumb) error
in my program, which caused a slight shift in alignment with each row.
I discovered the error upon awaking (11/11) and finding what I hoped would
be faithful renditions, smeared to the left. After correcting this
bug, I began again. Now 28 hours into what will be a 41 hour plot,
the results are telling.
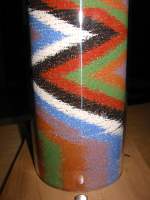
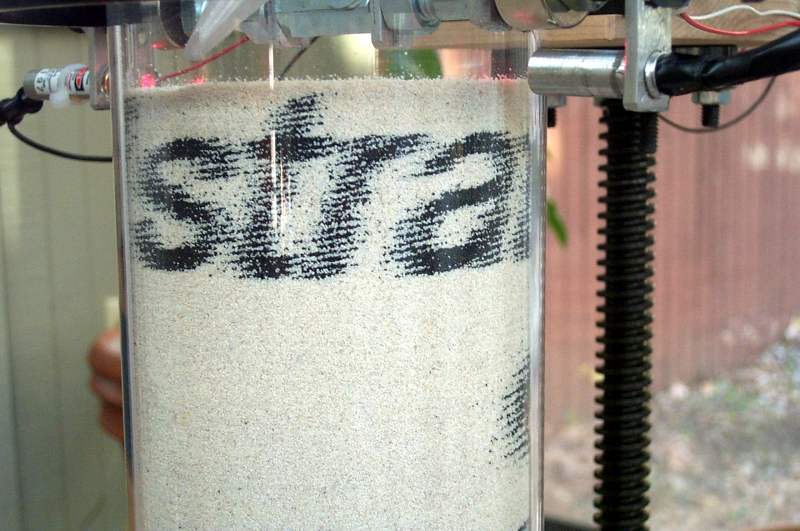
Nov. 11
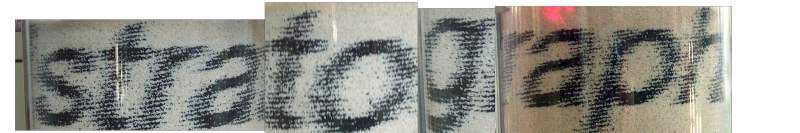
 A
little more ambitious-- tried doubling to 192 pixels/row, and more difficult
text. Not bad (3 hours, 25 min.
to complete, settings: valve open 30 msec, closed 1500 msec). To facilitate
this evaluation, have moved programming platform to C (stratro1.exe). Can
now load bitmaps, adjust solenoid timings, and pause plot to adjust parameters.
A
little more ambitious-- tried doubling to 192 pixels/row, and more difficult
text. Not bad (3 hours, 25 min.
to complete, settings: valve open 30 msec, closed 1500 msec). To facilitate
this evaluation, have moved programming platform to C (stratro1.exe). Can
now load bitmaps, adjust solenoid timings, and pause plot to adjust parameters.
Nov. 10
 Having
a reliable sandlevel-following apparatus, I returned focus upon feasibility
of reproducing bitmap images. Starting with 96 sanddump pixels per
revolution, I tried my first test image-- my
illustrious initials, which turned out upside down and backwards.
Naturally.
Having
a reliable sandlevel-following apparatus, I returned focus upon feasibility
of reproducing bitmap images. Starting with 96 sanddump pixels per
revolution, I tried my first test image-- my
illustrious initials, which turned out upside down and backwards.
Naturally.
Nov. 9
While the initial sand sensor circuitry appeared to work
well, as night fell, it became clear that ambient light conditions had
a marked effect. This appears due to the relatively weak IR signal
coming from the LED. To increase the "signal to noise ratio," I decided
to abandon the LED in favor of a visible laser
diode (using a hacked keychain laser pointer). Substituting the
pointer's three watch batteries with my 5 volt supply, knocked down to
~3.2V via diodes, it works just fine. The tight light spot raises
the potential for misalignment, so I spread the beam using a hemispherical
plastic lens. Initial tests (over night) worked perfectly. New
schematic.
Nov. 8
 Focused
upon instituting sand sensing. Used IR LED and phototransisitor similar
to Pipedream II. Had to add amplification in order to ensure enough
"distance" between light and dark. Used
empiric
method to discern optimal resistor values. Schematic.
Focused
upon instituting sand sensing. Used IR LED and phototransisitor similar
to Pipedream II. Had to add amplification in order to ensure enough
"distance" between light and dark. Used
empiric
method to discern optimal resistor values. Schematic.
 Using
new feedback capability, returned to pursuit of max res. Soon observed
the first clog. Closer inspection
reveals a tiny piece of paper (from sand bag)
lodged in orifice of nozzle. This raises the obvious need for
a filter (screen / mesh) in funnel.
Using
new feedback capability, returned to pursuit of max res. Soon observed
the first clog. Closer inspection
reveals a tiny piece of paper (from sand bag)
lodged in orifice of nozzle. This raises the obvious need for
a filter (screen / mesh) in funnel.
Nov. 7
 Initial
trials to ascertain max resolution. Early results are encouraging--
able to discern 96 distinct "pixels" around circumference.
Initial
trials to ascertain max resolution. Early results are encouraging--
able to discern 96 distinct "pixels" around circumference.
Nov. 6
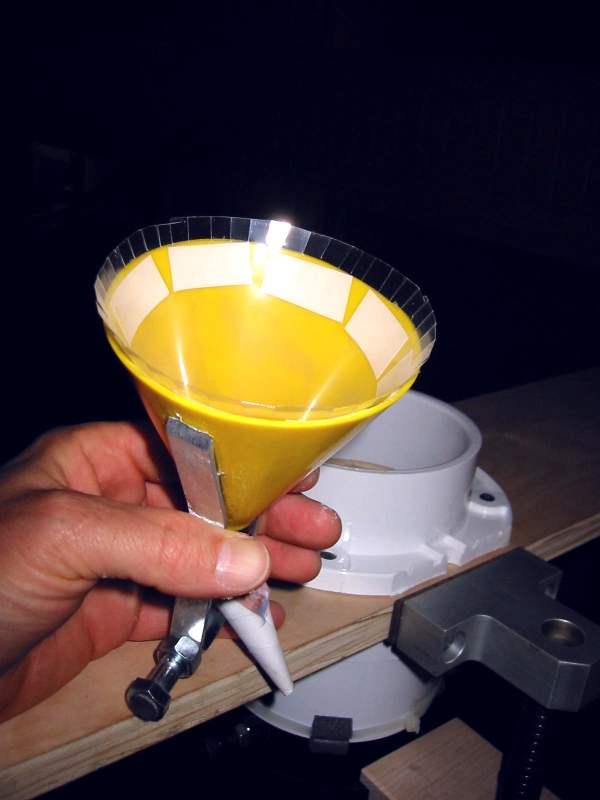
 The
first attempt at creating a decent seal between the sand director funnel
and the inside wall of the tube using felt was clearly unacceptable.
This new design is far better. Also, have started narrowing the director's
output spout, in preparation to evaluate maximum resolution.
The
first attempt at creating a decent seal between the sand director funnel
and the inside wall of the tube using felt was clearly unacceptable.
This new design is far better. Also, have started narrowing the director's
output spout, in preparation to evaluate maximum resolution.
October, 2001:
Oct. 29

Demonstrated the full-scale prototype for Dan, Robert,
Katrina, Eugene and met Robert Hone of Red
Hill Studios. Discussed a multitude of ideas, including possible
strategies for interactivity. Notable ideas: "sand pixel" color
as indicator of sensor activation rate / splitting column of sand into
front and back, with different pattern strategies.
Plan: I will investigate the resolution limit of
the machine, in hopes of being able to faithfully recreated bitmap images
in the sand. Robert H. to begin experiments with visualizing color patterns
in a virtual environment. Tentative meeting to show results in 3
weeks (prior to Thanksgiving).
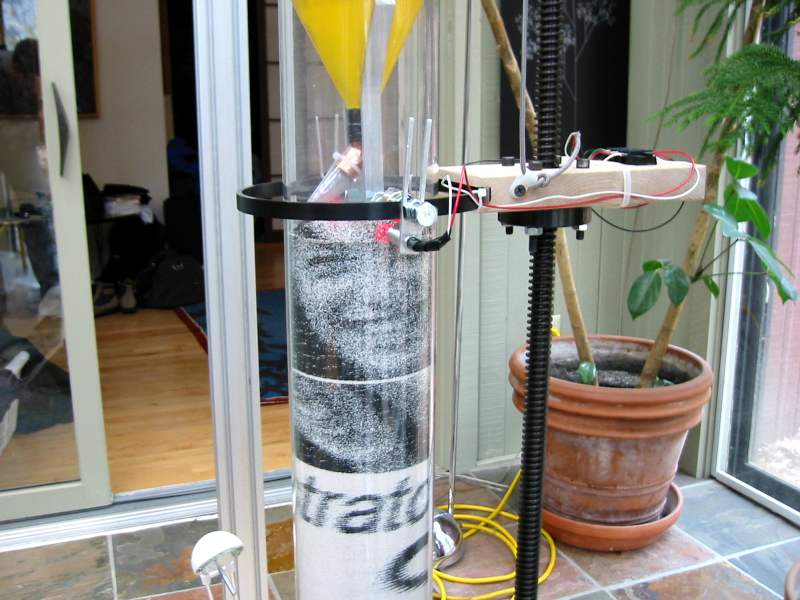
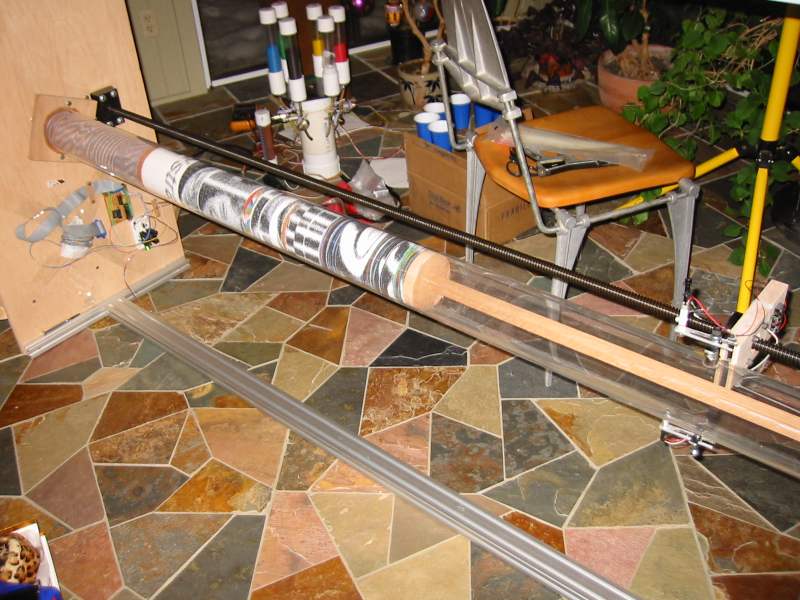
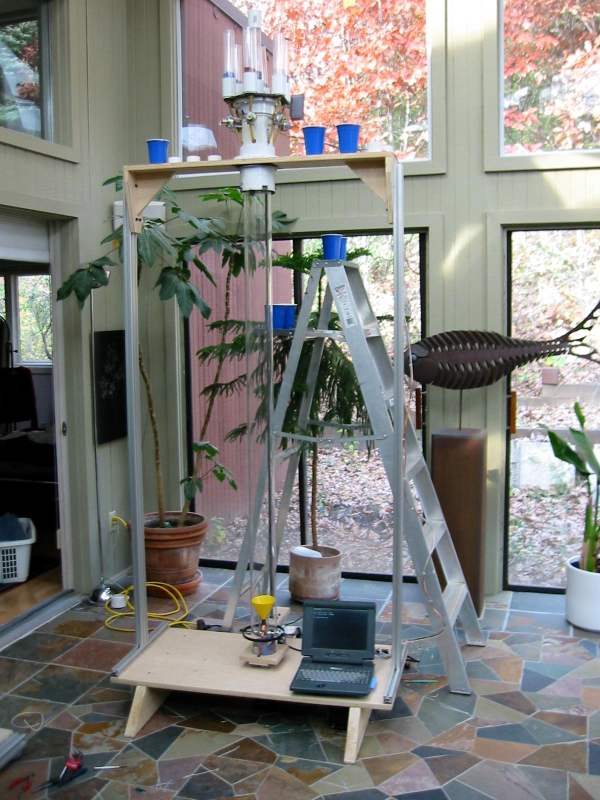
 After
examining various design configurations, set to work upon the full size
prototype. Extensively utilizing my assortment of scrounged motion
control components, it came together pretty quickly.
After
examining various design configurations, set to work upon the full size
prototype. Extensively utilizing my assortment of scrounged motion
control components, it came together pretty quickly.
The acrylic tube was purchased from Crown Plastics,
and came in at $114. This is cast (vs. extruded), and although significantly
more expensive, is gorgeous. The lead screw is overkill-- but it's
the right length, and looks good. The Z-axis stepper and the Theta-axis
steppers took a while to mount-- theta has an 18:1 gearhead which is also
overkill, but since the tube will weigh in ~100lbs when full, why not.
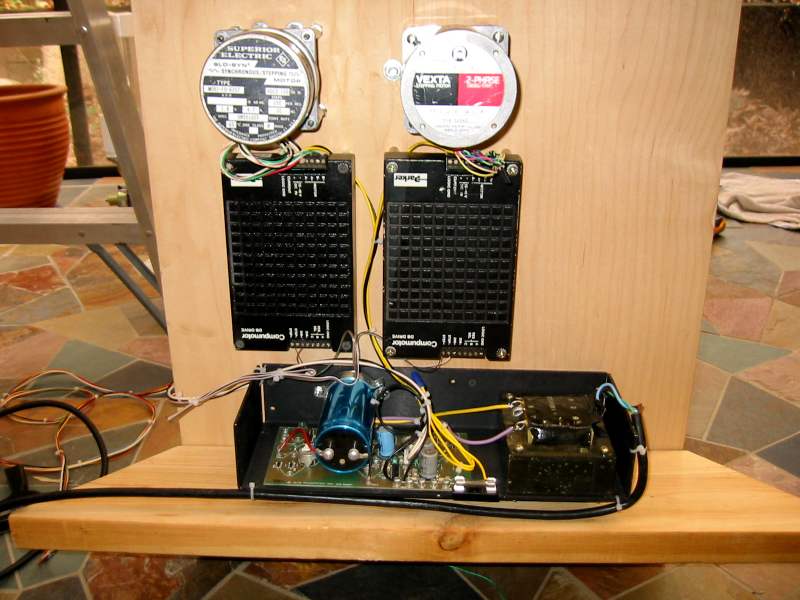
(view
of the motor and drive layout on the underside)
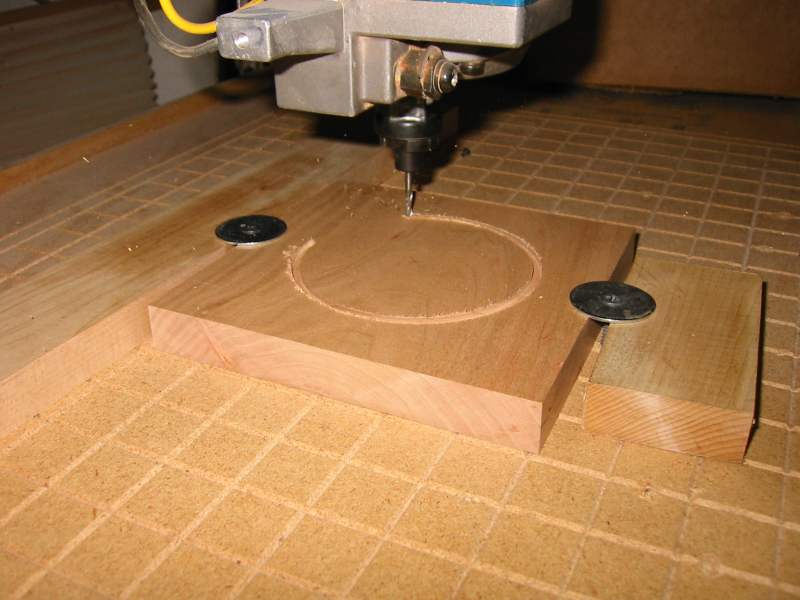
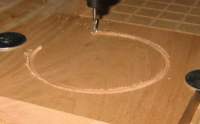 To
accomplish the capping off of the tube's ends, I enlisted the use of my
CNC router. Using a 1/8" end mill, and a 3-15/16" diameter circular
path, resulted in a perfect fit.
To
accomplish the capping off of the tube's ends, I enlisted the use of my
CNC router. Using a 1/8" end mill, and a 3-15/16" diameter circular
path, resulted in a perfect fit.

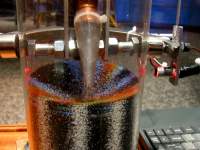
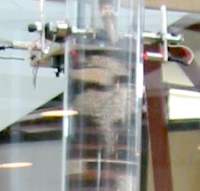
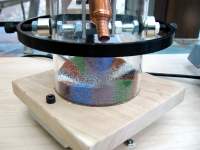
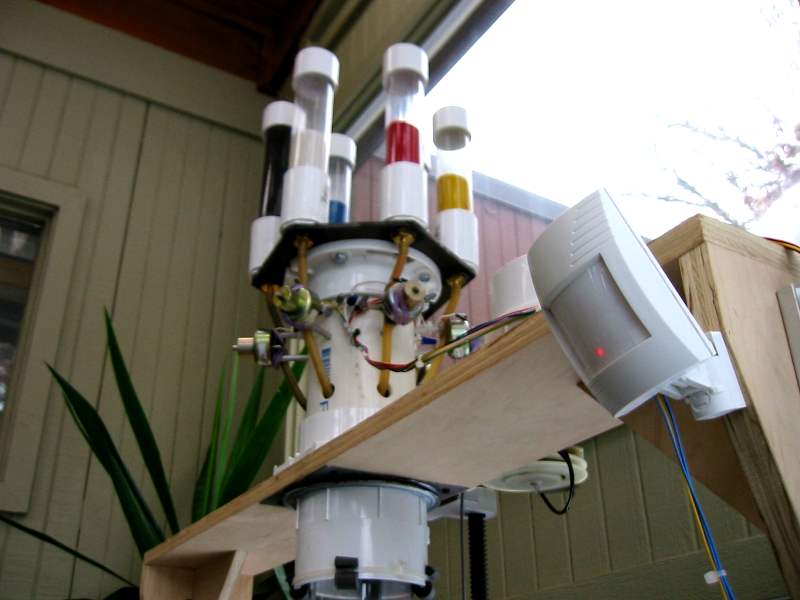
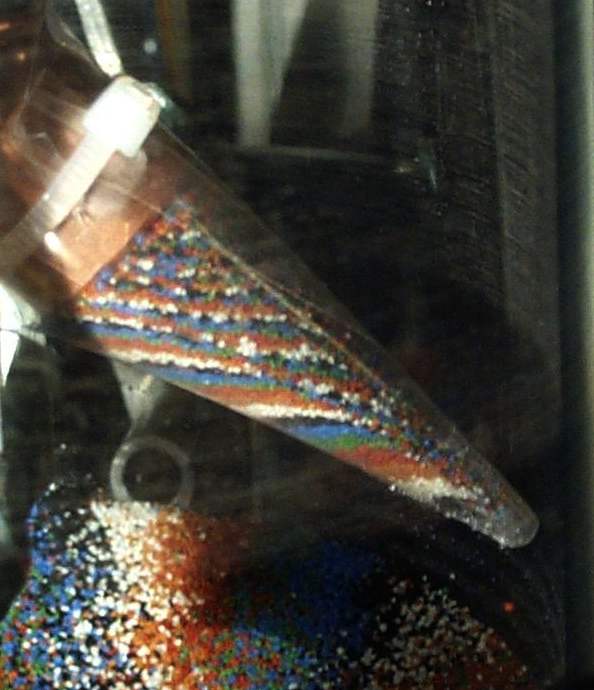
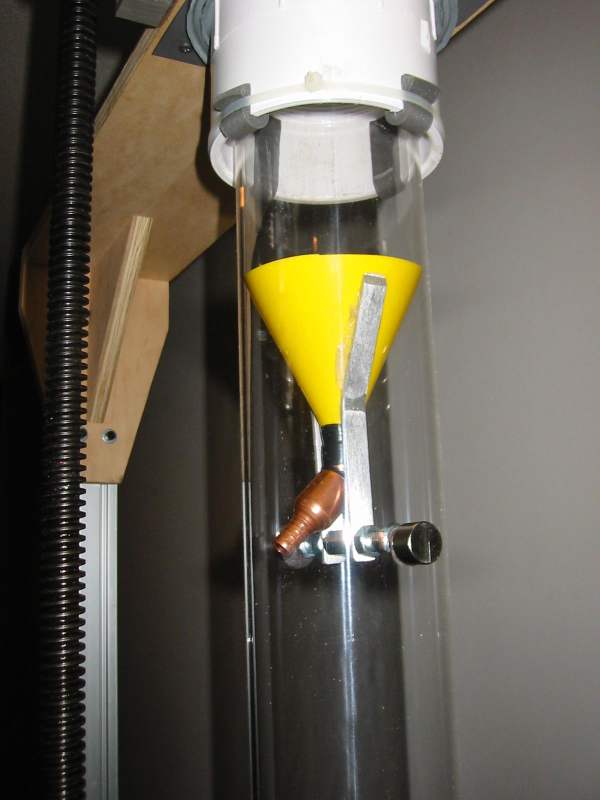
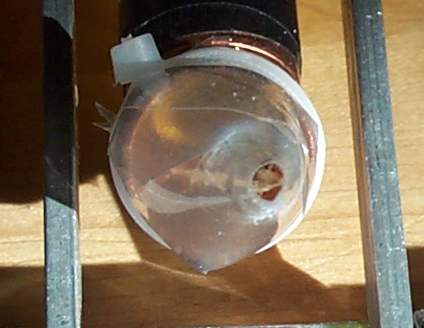
After testing the two axes, and mounting the top tube
holder / lazy susan, turned attention to the magnetically coupled sand
director. After toying with a number of strategies, I decided to
follow the simplest: a funnel, a 45 degree copper coupling, and a
handful of nuts and bolts. Plus two rare-earth mags.
While a number of improvements will be made, this works reasonably well!
 Because
of time constraints (I leave for NYC on 10/24), I have stolen
the maquette's sand delivery system for testing of the full size proto.
There are some sand leaks around the funnel, but the initial tests look
great.
Because
of time constraints (I leave for NYC on 10/24), I have stolen
the maquette's sand delivery system for testing of the full size proto.
There are some sand leaks around the funnel, but the initial tests look
great.
September 12, 2001
Met with Dan, Katrina, Robert and Bart. Prelim
design presented, along with weights and estimated costs of various tube
lengths and diameters. 6' length and 4" diameter agreed upon for
first full scale testing. Full scale, functional prototype to be
accomplished by end of October.
May 25, 2001
Proposal accepted.
May 23, 2001
Presented the stratograph maquette.
April-May, 2001
Development and testing of ideas. Concerns about
practicality of teardown and setup inherent in a traveling exhibit prompted
idea of archiving "sedimentation cores."
April 9, 2001
Received RFP.
 _
_ 23
days since the opening, and all is well. Visitors appear to be genuinely
engaged, and despite the lack of finished signage, many seem to be "getting"
it. The only unexpected finding has been that the archived tube has
settled an additional ~1/2"-- undoubtedly due to visitors moving it back
and forth. This raises the need for a threaded plug on the top wood
block, which will allow periodic "topping off" with black sand.
23
days since the opening, and all is well. Visitors appear to be genuinely
engaged, and despite the lack of finished signage, many seem to be "getting"
it. The only unexpected finding has been that the archived tube has
settled an additional ~1/2"-- undoubtedly due to visitors moving it back
and forth. This raises the need for a threaded plug on the top wood
block, which will allow periodic "topping off" with black sand.


